The Bitcoin Bull Run Blueprint: A Chart with a 100% Accuracy Rate?
What if you had access to a chart that—every single time in this bull cycle—accurately predicted Bitcoin’s next move?
Well… we do have that chart.
This article breaks down the most important technical indicator set that has consistently forecasted Bitcoin’s trends with near-perfect accuracy. You’ll also learn how Ethereum’s sideways structure, key moving averages, and historical momentum signals are converging for what may be the next major breakout—or breakdown.
All Eyes On THIS Chart Right Now (Crypto Holders WARNING!)
📈 The “Bull Run Ribbon” and Its Perfect Track Record
Let’s start with the foundation: a simple group of four moving averages that, when viewed together, provide incredibly reliable signals on Bitcoin’s macro health.
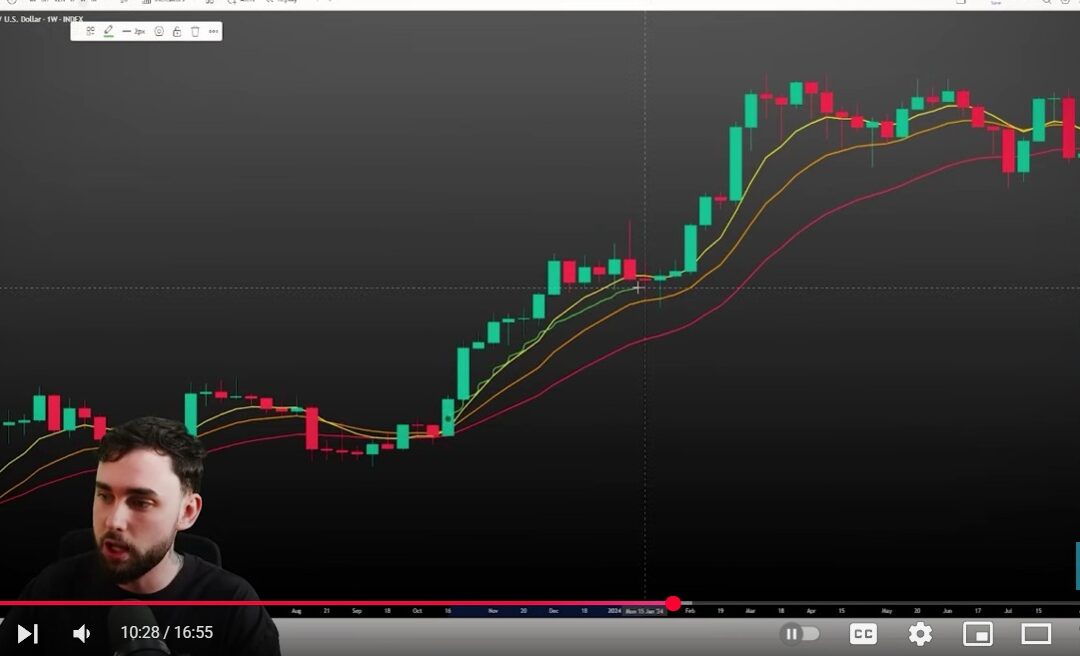
🟡 The 50-day EMA
Used frequently as dynamic support in bull runs.
🟠 The 100-day EMA
Intermediate-term trend tracker.
🔴 The 200-day EMA
The classic long-term support line.
🔵 The 365-day SMA
Also known as the one-year simple moving average, this blue line acts as a final support checkpoint. When price closes below this, historically, it signals heavy bearish momentum.
Together, these four indicators form what we call the Bull Run Ribbon.
🧠 Why These Averages Matter
Every single time these three EMAs (50/100/200) squeeze together, and price sits above the 365 SMA, an explosive move has followed—upward in bull cycles, and downward in bear cycles.
This pattern is currently in play right now.
-
Bitcoin has been respecting the 50-day EMA for several weeks.
-
The EMAs are tightening again—exactly like they did in late 2023 before the last breakout.
-
If Bitcoin closes below the 50-day and uses the 100-day as support, we could fall to the 200-day (~$93K).
-
If price closes below the 365-day SMA, that’s a full-blown bearish signal and likely the end of the bull run.
🪞Ethereum as the Altcoin Barometer
Ethereum has been trading sideways for 6 weeks with large wicks—a classic accumulation pattern similar to December 2023.
Here’s why this matters:
-
ETH often leads altcoin rallies.
-
Past Ethereum consolidations led to 70%+ moves.
-
Volume profiles on ETH suggest accumulation, not distribution.
This isn’t just Ethereum’s story—it’s a proxy for the rest of the altcoin market. If ETH breaks out, alts are likely to follow fast.
🔄 The MACD & RSI Confirmation
Both MACD and RSI are showing eerily similar structures to their last major bullish breakout phases.
MACD:
-
Expanding away from signal line → bullish momentum building
-
Current pattern mirrors that of December 2023
RSI:
-
Showing a potential bearish divergence (price makes higher highs, RSI makes lower highs)
-
If RSI fails to break out, it may confirm weakening momentum
🟨 Watch for a break above 70 RSI to confirm bullish momentum
🟥 Another lower high in RSI would be a red flag
💵 Stablecoin Ratio (SSRO) Analysis
When SSRO falls, it means stablecoins are entering the market to buy Bitcoin—bullish.
When it rises, it means stablecoins are leaving and capital is flowing out—bearish.
Right now:
-
SSRO has reset to a local bottom.
-
That gives bulls the fuel for another major leg up.
🧨 What Could Go Wrong? The Bear Case
Despite the bullish momentum, there are macro risks and black swan potentials:
-
Geopolitical instability in the Middle East
-
U.S. tariffs and trade policy uncertainty
-
Market fatigue or overbought conditions
If Bitcoin closes beneath the 100-day EMA and fails to hold the 200-day, a retest of the 365-day SMA (~$82.6K) could be on the table. That would signal a macro shift toward risk-off and begin a larger downtrend.
🔁 What History Says
Across every cycle since 2013:
-
Every time these moving averages squeeze, Bitcoin moves hard.
-
When price closes below the 365-day SMA, it marks the end of bullish momentum (unless reversed quickly—e.g., COVID crash 2020).
-
When EMAs stay above the 365-day SMA, bull runs continue.
So far in 2024, the structure mimics the 2023 launchpad. But fail to hold key EMAs, and history warns: the downside opens up fast.
📊 Final Thoughts: Eyes on the Ribbon
This isn’t about predicting the future—it’s about understanding momentum.
If Bitcoin holds the 50-day EMA, and Ethereum breaks its range, we could be headed toward the next major leg of the bull market.
If it fails, the 100-200-365 day structure will become your early warning system.
Want to track these metrics yourself?
🔍 On TradingView:
-
Add EMAs with inputs 50, 100, 200 (set to daily timeframe)
-
Add 365 SMA
-
Watch for candle closes relative to those lines
📈 Emoji of the Day: 📈
If you’re still bullish after reading this, drop a chart-up emoji in the comments to give Bitcoin the momentum push it needs.
For more direct updates, macro commentary, or deeper community access, check out the private group (links below).
Stay safe. Stay sharp.
See you next breakout.
Introducing DerDerDer Club ($DER)
 Where Memes Meet Music & Laughter Fuels the Blockchain! $DER — the world’s most playful community coin, built for the culture lovers, the meme creators, and the laughter dealers of the crypto world.
Join the DerDerDer Club – 🤣 Submit your funniest videos and win rewards, 👻 Fully transparent & community-led, 🎵 Where music meets memes in unexpected ways, 🚀 NFTs, meme video generators, and more coming soon!
This isn’t just another meme coin — it’s a musical movement for the fun-first generation of crypto. No drama. No complicated roadmaps. Just pure internet joy backed by real engagement and future utility.
Contract Address (Solana):
📜 GibJs7cETwyGZ6QbWZTSfDg9RV9HZZ4mPxfYD2AeKPPA